


/
Dec 16, 2024
OpenAI Incident Retro
OpenAI Incident Retro
Lessons from k8s Outages at Scale
Lessons from k8s Outages at Scale

Wilson Spearman
Co-founder of Parity

OpenAI recently published a detailed incident report about their December 11th outage, shedding light on what went wrong and how they’re addressing it. It’s not every day that we get detailed write-ups of production failures in large scale k8s services, so it’s a great opportunity to get a glimpse of real and unfiltered k8s incidents. The root cause? A misconfigured telemetry service overwhelmed Kubernetes API servers in their largest clusters, which cascaded into widespread service outages. The report also dives into their incident response process and plans for preventing similar issues in the future.
I encourage you to read the report from OpenAI first: I’ll build on it here rather than repeat it. Here’s a quick summary of the root cause:
A misconfigured telemetry service caused excessive Kubernetes API load across OpenAI's largest clusters, overwhelming the control plane. This broke DNS-based service discovery, leading to widespread outages in the data plane as well.
Key Takeaways from the Incident
1. Healthy in Staging, Deadly in Production
This incident underscores one of the biggest challenges of operating Kubernetes at scale: what works fine in staging can fail catastrophically in production. The telemetry service responsible for the outage ran without issues in staging but became problematic only on sufficiently large Kubernetes clusters—the kind found only in production.
The lesson? Staging environments rarely match production perfectly, especially at scale. While “shift left” testing accelerates velocity and catches many bugs early, progressive rollouts in production remain one of the best safeguards against outages caused by conditions unique to production environments. Sure, it's great to having staging perfectly mirror prod, but that is unfortunately not easily accomplished at a certain scale. The costs associated with putting large scale GPU clusters in staging would be enormous for a company like OpenAI.
2. Unexpected Dependencies Between Control Plane and Data Plane
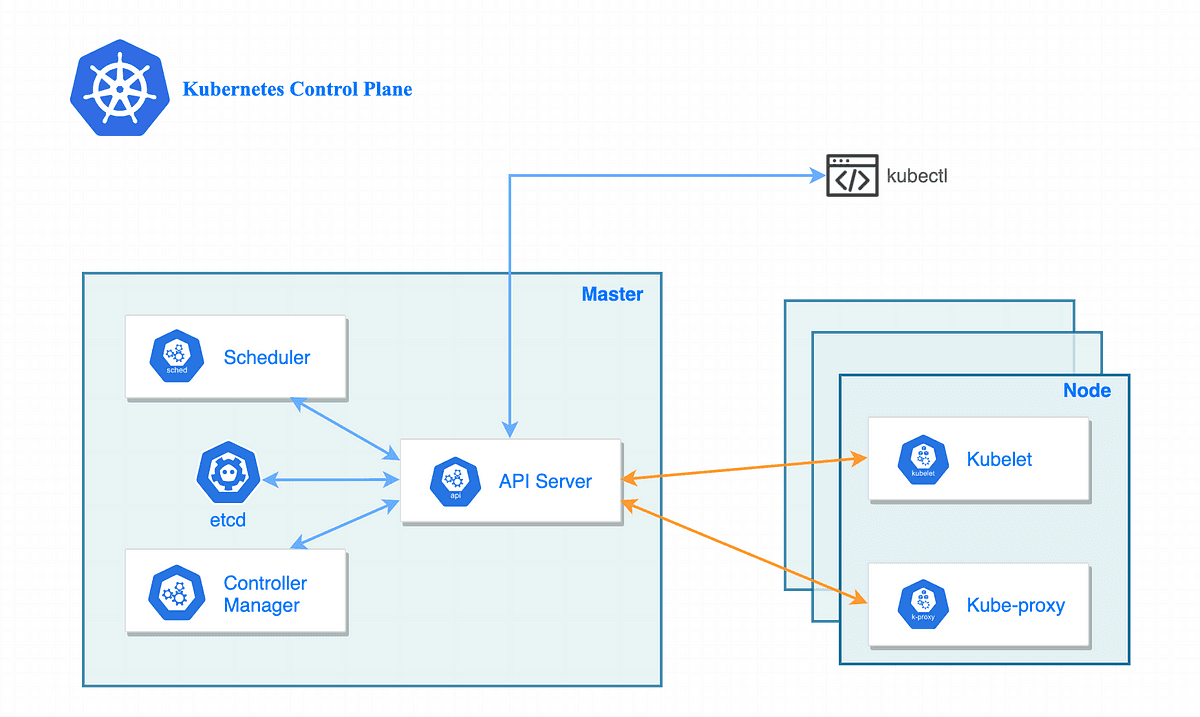
Typically, an overwhelmed control plane is bad news (but not catastrophic) for existing services in the data plane. Kubernetes’s design aims to provide abstraction and separation between the two. However, in this incident, a hidden dependency created a full-service outage. The complexity of Kubernetes can unfortunately make these dependencies extremely non-obvious.
Here’s what happened: DNS-based service discovery relied on the control plane. When the Kubernetes API server became overwhelmed, the DNS service broke, which caused data plane services relying on DNS to fail. DNS caching made the issue harder to spot initially, as cached records masked the problem. Once the cached records expired, DNS resolution failed, amplifying the outage and delaying remediation. This ultimately led to a collapse of both the control and data plane despite the root cause of the issue being exclusively related to the control plane.
3. Quick Discovery, Impossible Resolution
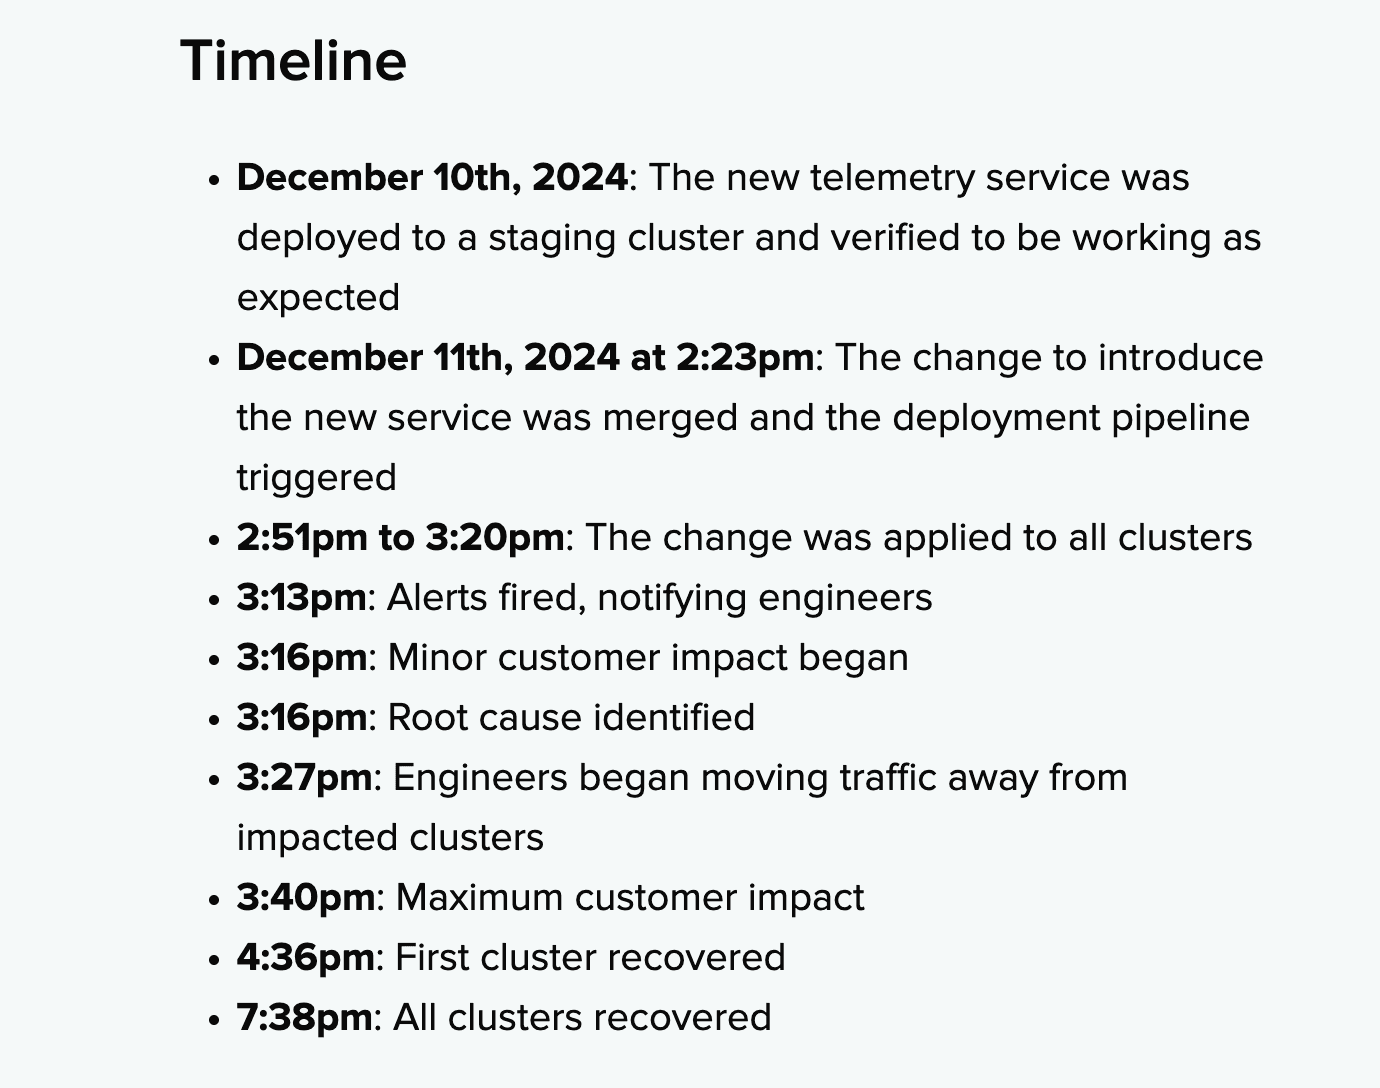
OpenAI’s engineers identified the root cause within 5 minutes of the first alerts firing at 3:13 PM. However, resolving the issue took over 4 hours due to the cascading failures. Even though the team quickly pinpointed the problematic telemetry service, the overwhelmed control plane created a catch-22 situation: DNS-based service discovery and other critical tools were unavailable because the incident itself affected those systems.
This highlights a recurring challenge in incident response: when the tools you rely on to fix issues are themselves impacted by the incident. Teams build up a subtle dependency on these tools over time, and when they're suddenly gone in a high stakes outage, it's a recipe for disaster. For teams operating at this scale, ensuring access to emergency tooling and control mechanisms—even under extreme pressure—is essential. Honestly, given the scale of the outage and the complexity in restoring API service health, the total amount of downtime was fairly limited. Kudos to the team.
4. The Role of Proactive Chaos Testing
The OpenAI incident highlights an often-overlooked aspect of chaos engineering: the need to test not just individual component failures (i.e. the DNS discovery service), but the interplay between infrastructure services. This incident suggests that comprehensive chaos engineering needs to evolve beyond simple failure injection toward full-scale "architectural chaos testing" - deliberately stressing the relationships between fundamental services (in this case DNS and API services). These experiments would reveal unexpected or unintentional dependencies that can become points of failure during incidents. A test like this could also validate that emergency response tools remain functional even when core infrastructure is compromised. This is extremely resource intensive and requires thoughtful planning, but for a team at the scale of OpenAI, it's worth exploring. I'm excited to see what they do here.
5. Invisible Delays and Amplification Loops
Perhaps the most insidious aspect of this incident was how DNS caching created a false sense of normalcy while problems quietly accumulated beneath the surface. This pattern of "invisible delay" followed by sudden cascade is particularly dangerous in distributed systems because it can bypass traditional progressive rollout safeguards if they're not appropriately calibrated. When failures are delayed and then compress into a narrow time window, the incident response becomes exponentially more challenging - teams must diagnose and fix multiple concurrent failures rather than addressing issues sequentially. It's also not clear to me why the cache was not designed to use stale data as a failover (as that would presumably mitigate some of the damage, the services in the data plane were likely healthy). Please ping me if you happen to know why they may have made this design choice.
Final Thoughts
I always appreciate when teams have transparency in incident retros. Not only is it genuinely interesting, it offers valuable insights and hard-won lessons for others operating at scale. For those of us without thousands of GPUs, there are broader insights into the human factors that go into an incident like this.
The full incident report contains even more detail, including their remediation steps and plans to improve reliability. If you’re interested in Kubernetes, large-scale systems, or incident response, it’s definitely worth a read!
OpenAI recently published a detailed incident report about their December 11th outage, shedding light on what went wrong and how they’re addressing it. It’s not every day that we get detailed write-ups of production failures in large scale k8s services, so it’s a great opportunity to get a glimpse of real and unfiltered k8s incidents. The root cause? A misconfigured telemetry service overwhelmed Kubernetes API servers in their largest clusters, which cascaded into widespread service outages. The report also dives into their incident response process and plans for preventing similar issues in the future.
I encourage you to read the report from OpenAI first: I’ll build on it here rather than repeat it. Here’s a quick summary of the root cause:
A misconfigured telemetry service caused excessive Kubernetes API load across OpenAI's largest clusters, overwhelming the control plane. This broke DNS-based service discovery, leading to widespread outages in the data plane as well.

Key Takeaways from the Incident
1. Healthy in Staging, Deadly in Production
This incident underscores one of the biggest challenges of operating Kubernetes at scale: what works fine in staging can fail catastrophically in production. The telemetry service responsible for the outage ran without issues in staging but became problematic only on sufficiently large Kubernetes clusters—the kind found only in production.
The lesson? Staging environments rarely match production perfectly, especially at scale. While “shift left” testing accelerates velocity and catches many bugs early, progressive rollouts in production remain one of the best safeguards against outages caused by conditions unique to production environments. Sure, it's great to having staging perfectly mirror prod, but that is unfortunately not easily accomplished at a certain scale. The costs associated with putting large scale GPU clusters in staging would be enormous for a company like OpenAI.
2. Unexpected Dependencies Between Control Plane and Data Plane
Typically, an overwhelmed control plane is bad news (but not catastrophic) for existing services in the data plane. Kubernetes’s design aims to provide abstraction and separation between the two. However, in this incident, a hidden dependency created a full-service outage. The complexity of Kubernetes can unfortunately make these dependencies extremely non-obvious.
Here’s what happened: DNS-based service discovery relied on the control plane. When the Kubernetes API server became overwhelmed, the DNS service broke, which caused data plane services relying on DNS to fail. DNS caching made the issue harder to spot initially, as cached records masked the problem. Once the cached records expired, DNS resolution failed, amplifying the outage and delaying remediation. This ultimately led to a collapse of both the control and data plane despite the root cause of the issue being exclusively related to the control plane.

3. Quick Discovery, Impossible Resolution
OpenAI’s engineers identified the root cause within 5 minutes of the first alerts firing at 3:13 PM. However, resolving the issue took over 4 hours due to the cascading failures. Even though the team quickly pinpointed the problematic telemetry service, the overwhelmed control plane created a catch-22 situation: DNS-based service discovery and other critical tools were unavailable because the incident itself affected those systems.
This highlights a recurring challenge in incident response: when the tools you rely on to fix issues are themselves impacted by the incident. Teams build up a subtle dependency on these tools over time, and when they're suddenly gone in a high stakes outage, it's a recipe for disaster. For teams operating at this scale, ensuring access to emergency tooling and control mechanisms—even under extreme pressure—is essential. Honestly, given the scale of the outage and the complexity in restoring API service health, the total amount of downtime was fairly limited. Kudos to the team.

4. The Role of Proactive Chaos Testing
The OpenAI incident highlights an often-overlooked aspect of chaos engineering: the need to test not just individual component failures (i.e. the DNS discovery service), but the interplay between infrastructure services. This incident suggests that comprehensive chaos engineering needs to evolve beyond simple failure injection toward full-scale "architectural chaos testing" - deliberately stressing the relationships between fundamental services (in this case DNS and API services). These experiments would reveal unexpected or unintentional dependencies that can become points of failure during incidents. A test like this could also validate that emergency response tools remain functional even when core infrastructure is compromised. This is extremely resource intensive and requires thoughtful planning, but for a team at the scale of OpenAI, it's worth exploring. I'm excited to see what they do here.
5. Invisible Delays and Amplification Loops
Perhaps the most insidious aspect of this incident was how DNS caching created a false sense of normalcy while problems quietly accumulated beneath the surface. This pattern of "invisible delay" followed by sudden cascade is particularly dangerous in distributed systems because it can bypass traditional progressive rollout safeguards if they're not appropriately calibrated. When failures are delayed and then compress into a narrow time window, the incident response becomes exponentially more challenging - teams must diagnose and fix multiple concurrent failures rather than addressing issues sequentially. It's also not clear to me why the cache was not designed to use stale data as a failover (as that would presumably mitigate some of the damage, the services in the data plane were likely healthy). Please ping me if you happen to know why they may have made this design choice.
Final Thoughts
I always appreciate when teams have transparency in incident retros. Not only is it genuinely interesting, it offers valuable insights and hard-won lessons for others operating at scale. For those of us without thousands of GPUs, there are broader insights into the human factors that go into an incident like this.
The full incident report contains even more detail, including their remediation steps and plans to improve reliability. If you’re interested in Kubernetes, large-scale systems, or incident response, it’s definitely worth a read!
OpenAI recently published a detailed incident report about their December 11th outage, shedding light on what went wrong and how they’re addressing it. It’s not every day that we get detailed write-ups of production failures in large scale k8s services, so it’s a great opportunity to get a glimpse of real and unfiltered k8s incidents. The root cause? A misconfigured telemetry service overwhelmed Kubernetes API servers in their largest clusters, which cascaded into widespread service outages. The report also dives into their incident response process and plans for preventing similar issues in the future.
I encourage you to read the report from OpenAI first: I’ll build on it here rather than repeat it. Here’s a quick summary of the root cause:
A misconfigured telemetry service caused excessive Kubernetes API load across OpenAI's largest clusters, overwhelming the control plane. This broke DNS-based service discovery, leading to widespread outages in the data plane as well.

Key Takeaways from the Incident
1. Healthy in Staging, Deadly in Production
This incident underscores one of the biggest challenges of operating Kubernetes at scale: what works fine in staging can fail catastrophically in production. The telemetry service responsible for the outage ran without issues in staging but became problematic only on sufficiently large Kubernetes clusters—the kind found only in production.
The lesson? Staging environments rarely match production perfectly, especially at scale. While “shift left” testing accelerates velocity and catches many bugs early, progressive rollouts in production remain one of the best safeguards against outages caused by conditions unique to production environments. Sure, it's great to having staging perfectly mirror prod, but that is unfortunately not easily accomplished at a certain scale. The costs associated with putting large scale GPU clusters in staging would be enormous for a company like OpenAI.
2. Unexpected Dependencies Between Control Plane and Data Plane
Typically, an overwhelmed control plane is bad news (but not catastrophic) for existing services in the data plane. Kubernetes’s design aims to provide abstraction and separation between the two. However, in this incident, a hidden dependency created a full-service outage. The complexity of Kubernetes can unfortunately make these dependencies extremely non-obvious.
Here’s what happened: DNS-based service discovery relied on the control plane. When the Kubernetes API server became overwhelmed, the DNS service broke, which caused data plane services relying on DNS to fail. DNS caching made the issue harder to spot initially, as cached records masked the problem. Once the cached records expired, DNS resolution failed, amplifying the outage and delaying remediation. This ultimately led to a collapse of both the control and data plane despite the root cause of the issue being exclusively related to the control plane.

3. Quick Discovery, Impossible Resolution
OpenAI’s engineers identified the root cause within 5 minutes of the first alerts firing at 3:13 PM. However, resolving the issue took over 4 hours due to the cascading failures. Even though the team quickly pinpointed the problematic telemetry service, the overwhelmed control plane created a catch-22 situation: DNS-based service discovery and other critical tools were unavailable because the incident itself affected those systems.
This highlights a recurring challenge in incident response: when the tools you rely on to fix issues are themselves impacted by the incident. Teams build up a subtle dependency on these tools over time, and when they're suddenly gone in a high stakes outage, it's a recipe for disaster. For teams operating at this scale, ensuring access to emergency tooling and control mechanisms—even under extreme pressure—is essential. Honestly, given the scale of the outage and the complexity in restoring API service health, the total amount of downtime was fairly limited. Kudos to the team.

4. The Role of Proactive Chaos Testing
The OpenAI incident highlights an often-overlooked aspect of chaos engineering: the need to test not just individual component failures (i.e. the DNS discovery service), but the interplay between infrastructure services. This incident suggests that comprehensive chaos engineering needs to evolve beyond simple failure injection toward full-scale "architectural chaos testing" - deliberately stressing the relationships between fundamental services (in this case DNS and API services). These experiments would reveal unexpected or unintentional dependencies that can become points of failure during incidents. A test like this could also validate that emergency response tools remain functional even when core infrastructure is compromised. This is extremely resource intensive and requires thoughtful planning, but for a team at the scale of OpenAI, it's worth exploring. I'm excited to see what they do here.
5. Invisible Delays and Amplification Loops
Perhaps the most insidious aspect of this incident was how DNS caching created a false sense of normalcy while problems quietly accumulated beneath the surface. This pattern of "invisible delay" followed by sudden cascade is particularly dangerous in distributed systems because it can bypass traditional progressive rollout safeguards if they're not appropriately calibrated. When failures are delayed and then compress into a narrow time window, the incident response becomes exponentially more challenging - teams must diagnose and fix multiple concurrent failures rather than addressing issues sequentially. It's also not clear to me why the cache was not designed to use stale data as a failover (as that would presumably mitigate some of the damage, the services in the data plane were likely healthy). Please ping me if you happen to know why they may have made this design choice.
Final Thoughts
I always appreciate when teams have transparency in incident retros. Not only is it genuinely interesting, it offers valuable insights and hard-won lessons for others operating at scale. For those of us without thousands of GPUs, there are broader insights into the human factors that go into an incident like this.
The full incident report contains even more detail, including their remediation steps and plans to improve reliability. If you’re interested in Kubernetes, large-scale systems, or incident response, it’s definitely worth a read!
Share
HN
Revolutionize Your Incident Response
Revolutionize Your Incident Response
Transform your on-call with Parity's AI SRE. Parity works with your team to resolve incidents in seconds, not hours.
Transform your on-call with Parity's AI SRE. Parity works with your team to resolve incidents in seconds, not hours.

You may also like
You may also like


Wilson Spearman
Co-founder
Mar 20, 2025
You Spend Millions on Reliability. So why Does Everything Still Break?
Reliability's Expensive and Everything Still Breaks. Why?


Wilson Spearman
Co-founder
Mar 20, 2025
You Spend Millions on Reliability. So why Does Everything Still Break?
Reliability's Expensive and Everything Still Breaks. Why?


Wilson Spearman
Co-founder
Jan 31, 2025
Is the Helm Killer Finally Here?
AWS, Google Cloud, and Microsoft unveil kro, a k8s-native, cloud-agnostic package manager


Wilson Spearman
Co-founder
Jan 31, 2025
Is the Helm Killer Finally Here?
AWS, Google Cloud, and Microsoft unveil kro, a k8s-native, cloud-agnostic package manager
