


/
Oct 30, 2024
How to Debug CrashLoopBackOff in Kubernetes
How to Debug CrashLoopBackOff in Kubernetes
A Step-by-Step Guide to Debugging CrashLoopBackoff issues in k8s
A Step-by-Step Guide to Debugging CrashLoopBackoff issues in k8s

Wilson Spearman
Co-founder of Parity

What is CrashLoopBackoff?
Chances are, if you're working with Kubernetes, you'll see your pod in the dreaded CrashLoopBackoff state soon enough. But what exactly does it mean? CrashLoopBackOff is a status Kubernetes assigns to pods that continuously fail to start correctly. When a container within a pod exits too quickly, Kubernetes attempts to restart it. If the container keeps failing, the pod enters a CrashLoopBackOff state. The “back-off” part of the term refers to Kubernetes’s behavior of progressively delaying restart attempts. CrashLoopBackoff errors can be particularly frustrating as there are many potential root causes, making debugging a challenge.
Common Causes of CrashLoopBackOff in k8s
Several factors can lead to a pod in CrashLoopBackOff, including application configuration issues, dependency issues, or misconfigured environment variables. Other common causes include insufficient resources, failed readiness or liveness probes, and failed init containers. We've found that the best way to debug is to first consider recent changes (a recent deployment, code changes, updates to CI/CD pipelines), and then work through each potential root cause systematically until the culprit is found. Lets walk through how to identify each of these potential causes in the next section.
Finding Errors using the Pod Description
Find the Bad Pod
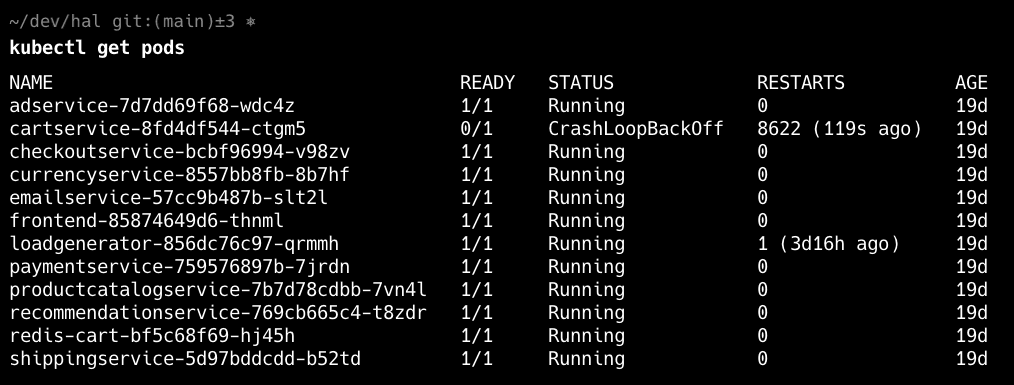
The first step to diagnosing a CrashLoopBackOff error is to confirm which pods are affected. Use the command kubectl get pods to identify all pods in your namespace and look for those in a CrashLoopBackOff state. The following steps rely on knowing which pods we want to investigate further.
Get Detailed Pod Info with Pod Description
Once you identify the problematic pod, run kubectl describe pod <pod-name> for a more detailed view of the pod's configuration . This command provides a breakdown of the pod’s configuration and recent events, and will help you find or rule out several of the above causes. We find that this command will reveal a majority of errors. Key sections to examine are “Events,” which logs Kubernetes system messages, and “Conditions,” where issues like failed readiness probes or image pull errors may appear.
Identifying Container Errors
If you suspect container-specific issues, start by checking for image pull failures, which can prevent your pod from starting. The kubectl describe output can reveal if there were authentication errors, incorrect image tags, or registry issues. Additionally, ensure the container has the necessary permissions and that any required files or directories are present in the container filesystem.
Identifying Resource Constraints
A common cause of CrashLoopBackOff is resource constraints. If a container doesn’t have enough memory or CPU to run, it may be terminated repeatedly. Use kubectl describe pod <pod-name> to check the resource limits and requests set for the pod. For real-time data, kubectl top pod provides insight into current resource usage, which may reveal if resource limits need adjusting.
Identifying Health Probe Errors
A misconfigured readiness or liveness probe can place a pod in CrashLoopBackoff as Kubernetes uses the probes to check the health of a service and will restart pods that don't have successful health checks. Review the configuration of these probes to ensure they align with your application’s actual health endpoints. You can manually test these endpoints with tools like curl to confirm they return the expected responses. Setting probe failure thresholds and timeouts appropriately is crucial to avoid unnecessary restarts.
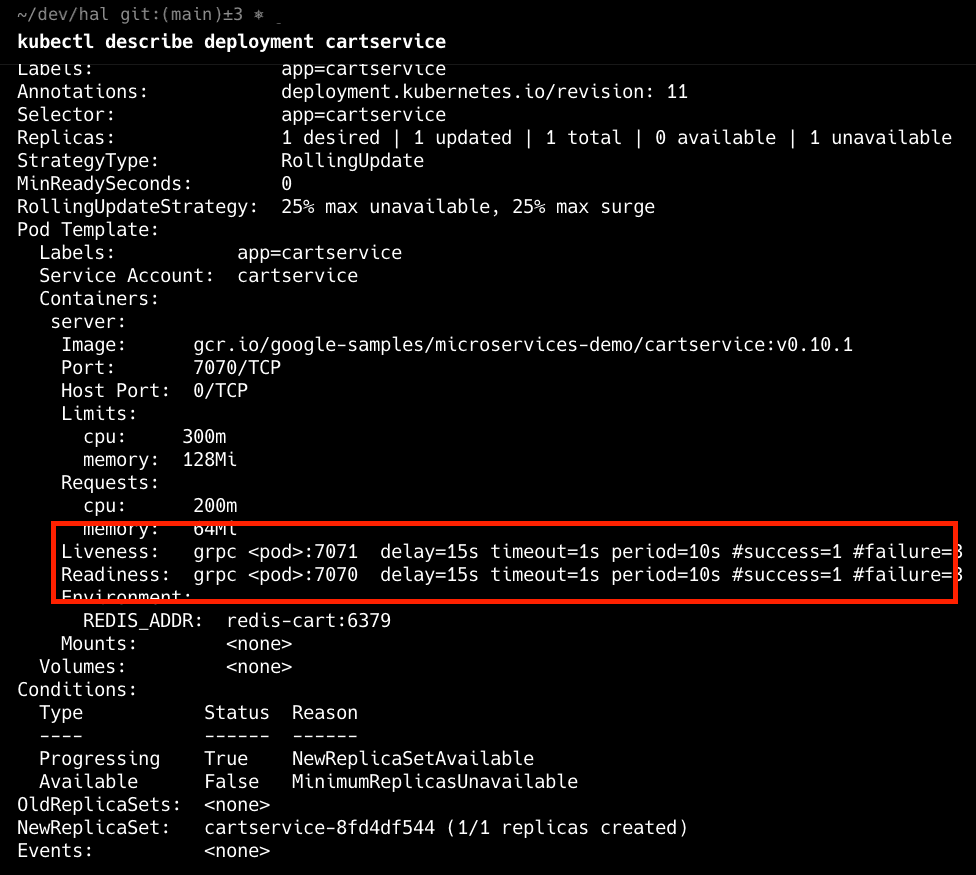
In the above deployment, we can see that the liveness and readiness probes are misconfigured to the wrong ports.
Analyzing Pod Logs for More Clues
If the previous steps didn't reveal the issue, it's time to dig into the pod's logs. Use kubectl logs <pod-name> --tail 20 to view the past 20 logs for your pod. Review these logs for patterns like stack traces, configuration errors, or messages about missing dependencies. If the error appears before your application has even started (and therefore isn't being logged), it may indicate a problem with the pod's entry point or configuration.

Don't Forget to Check the Deployment
Sometimes the root cause of a CrashLoopBackOff state lies not with the pod itself but with the deployment configuration. A deployment’s configuration determines how many replicas are managed, how they’re updated, and what configurations or limits are applied. Start by describing the deployment with:
kubectl describe deployment <deployment-name>Check for any issues in the deployment specification, such as:
Incorrect Resource Limits: If CPU or memory limits are too restrictive, pods may fail to start or restart frequently. Adjust resource requests and limits in the deployment spec to ensure the pod has enough resources.
Rolling Updates: Look for rollout-related events, especially if you recently updated the deployment. Misconfigurations in
maxUnavailableormaxSurgecan impact pod stability.Environment Variables and Secrets: If the pod depends on environment variables or secrets defined in the deployment, make sure they are correctly configured and accessible.
How Parity Uses AI to Debug CrashLoopBackoff and other k8s issues
At Parity, we've built an AI SRE for incident response. Nobody likes waking up at 2am and investigating an issue in production. Instead, Parity investigates that issue on your behalf and hands over the results to you so you can quickly resolve the issue and get back to bed. CrashLoopBackoff has many potential causes, and Parity can evaluate them all at once and quickly pinpoint the issue. If you're interested in giving it a try, book a demo with us! If you want to learn more about why we've built Parity, check out our launch post!
Conclusion
Debugging CrashLoopBackOff errors in Kubernetes might seem overwhelming, but tackling it step-by-step makes it much easier to manage. By checking pod descriptions, digging into logs, and looking over your health probes and deployments, you can usually spot the issue pretty quickly. Plus, using tools like Parity’s AI SRE can take a lot of the hassle out of troubleshooting, handling the heavy lifting so you can solve problems faster and keep things running smoothly. With these tips and tools in hand, you’ll be ready to take on CrashLoopBackOff errors and keep your Kubernetes apps up and running without breaking a sweat.
What is CrashLoopBackoff?
Chances are, if you're working with Kubernetes, you'll see your pod in the dreaded CrashLoopBackoff state soon enough. But what exactly does it mean? CrashLoopBackOff is a status Kubernetes assigns to pods that continuously fail to start correctly. When a container within a pod exits too quickly, Kubernetes attempts to restart it. If the container keeps failing, the pod enters a CrashLoopBackOff state. The “back-off” part of the term refers to Kubernetes’s behavior of progressively delaying restart attempts. CrashLoopBackoff errors can be particularly frustrating as there are many potential root causes, making debugging a challenge.
Common Causes of CrashLoopBackOff in k8s
Several factors can lead to a pod in CrashLoopBackOff, including application configuration issues, dependency issues, or misconfigured environment variables. Other common causes include insufficient resources, failed readiness or liveness probes, and failed init containers. We've found that the best way to debug is to first consider recent changes (a recent deployment, code changes, updates to CI/CD pipelines), and then work through each potential root cause systematically until the culprit is found. Lets walk through how to identify each of these potential causes in the next section.
Finding Errors using the Pod Description
Find the Bad Pod
The first step to diagnosing a CrashLoopBackOff error is to confirm which pods are affected. Use the command kubectl get pods to identify all pods in your namespace and look for those in a CrashLoopBackOff state. The following steps rely on knowing which pods we want to investigate further.

Get Detailed Pod Info with Pod Description
Once you identify the problematic pod, run kubectl describe pod <pod-name> for a more detailed view of the pod's configuration . This command provides a breakdown of the pod’s configuration and recent events, and will help you find or rule out several of the above causes. We find that this command will reveal a majority of errors. Key sections to examine are “Events,” which logs Kubernetes system messages, and “Conditions,” where issues like failed readiness probes or image pull errors may appear.
Identifying Container Errors
If you suspect container-specific issues, start by checking for image pull failures, which can prevent your pod from starting. The kubectl describe output can reveal if there were authentication errors, incorrect image tags, or registry issues. Additionally, ensure the container has the necessary permissions and that any required files or directories are present in the container filesystem.
Identifying Resource Constraints
A common cause of CrashLoopBackOff is resource constraints. If a container doesn’t have enough memory or CPU to run, it may be terminated repeatedly. Use kubectl describe pod <pod-name> to check the resource limits and requests set for the pod. For real-time data, kubectl top pod provides insight into current resource usage, which may reveal if resource limits need adjusting.
Identifying Health Probe Errors
A misconfigured readiness or liveness probe can place a pod in CrashLoopBackoff as Kubernetes uses the probes to check the health of a service and will restart pods that don't have successful health checks. Review the configuration of these probes to ensure they align with your application’s actual health endpoints. You can manually test these endpoints with tools like curl to confirm they return the expected responses. Setting probe failure thresholds and timeouts appropriately is crucial to avoid unnecessary restarts.

In the above deployment, we can see that the liveness and readiness probes are misconfigured to the wrong ports.
Analyzing Pod Logs for More Clues
If the previous steps didn't reveal the issue, it's time to dig into the pod's logs. Use kubectl logs <pod-name> --tail 20 to view the past 20 logs for your pod. Review these logs for patterns like stack traces, configuration errors, or messages about missing dependencies. If the error appears before your application has even started (and therefore isn't being logged), it may indicate a problem with the pod's entry point or configuration.

Don't Forget to Check the Deployment
Sometimes the root cause of a CrashLoopBackOff state lies not with the pod itself but with the deployment configuration. A deployment’s configuration determines how many replicas are managed, how they’re updated, and what configurations or limits are applied. Start by describing the deployment with:
kubectl describe deployment <deployment-name>Check for any issues in the deployment specification, such as:
Incorrect Resource Limits: If CPU or memory limits are too restrictive, pods may fail to start or restart frequently. Adjust resource requests and limits in the deployment spec to ensure the pod has enough resources.
Rolling Updates: Look for rollout-related events, especially if you recently updated the deployment. Misconfigurations in
maxUnavailableormaxSurgecan impact pod stability.Environment Variables and Secrets: If the pod depends on environment variables or secrets defined in the deployment, make sure they are correctly configured and accessible.
How Parity Uses AI to Debug CrashLoopBackoff and other k8s issues
At Parity, we've built an AI SRE for incident response. Nobody likes waking up at 2am and investigating an issue in production. Instead, Parity investigates that issue on your behalf and hands over the results to you so you can quickly resolve the issue and get back to bed. CrashLoopBackoff has many potential causes, and Parity can evaluate them all at once and quickly pinpoint the issue. If you're interested in giving it a try, book a demo with us! If you want to learn more about why we've built Parity, check out our launch post!
Conclusion
Debugging CrashLoopBackOff errors in Kubernetes might seem overwhelming, but tackling it step-by-step makes it much easier to manage. By checking pod descriptions, digging into logs, and looking over your health probes and deployments, you can usually spot the issue pretty quickly. Plus, using tools like Parity’s AI SRE can take a lot of the hassle out of troubleshooting, handling the heavy lifting so you can solve problems faster and keep things running smoothly. With these tips and tools in hand, you’ll be ready to take on CrashLoopBackOff errors and keep your Kubernetes apps up and running without breaking a sweat.
What is CrashLoopBackoff?
Chances are, if you're working with Kubernetes, you'll see your pod in the dreaded CrashLoopBackoff state soon enough. But what exactly does it mean? CrashLoopBackOff is a status Kubernetes assigns to pods that continuously fail to start correctly. When a container within a pod exits too quickly, Kubernetes attempts to restart it. If the container keeps failing, the pod enters a CrashLoopBackOff state. The “back-off” part of the term refers to Kubernetes’s behavior of progressively delaying restart attempts. CrashLoopBackoff errors can be particularly frustrating as there are many potential root causes, making debugging a challenge.
Common Causes of CrashLoopBackOff in k8s
Several factors can lead to a pod in CrashLoopBackOff, including application configuration issues, dependency issues, or misconfigured environment variables. Other common causes include insufficient resources, failed readiness or liveness probes, and failed init containers. We've found that the best way to debug is to first consider recent changes (a recent deployment, code changes, updates to CI/CD pipelines), and then work through each potential root cause systematically until the culprit is found. Lets walk through how to identify each of these potential causes in the next section.
Finding Errors using the Pod Description
Find the Bad Pod
The first step to diagnosing a CrashLoopBackOff error is to confirm which pods are affected. Use the command kubectl get pods to identify all pods in your namespace and look for those in a CrashLoopBackOff state. The following steps rely on knowing which pods we want to investigate further.

Get Detailed Pod Info with Pod Description
Once you identify the problematic pod, run kubectl describe pod <pod-name> for a more detailed view of the pod's configuration . This command provides a breakdown of the pod’s configuration and recent events, and will help you find or rule out several of the above causes. We find that this command will reveal a majority of errors. Key sections to examine are “Events,” which logs Kubernetes system messages, and “Conditions,” where issues like failed readiness probes or image pull errors may appear.
Identifying Container Errors
If you suspect container-specific issues, start by checking for image pull failures, which can prevent your pod from starting. The kubectl describe output can reveal if there were authentication errors, incorrect image tags, or registry issues. Additionally, ensure the container has the necessary permissions and that any required files or directories are present in the container filesystem.
Identifying Resource Constraints
A common cause of CrashLoopBackOff is resource constraints. If a container doesn’t have enough memory or CPU to run, it may be terminated repeatedly. Use kubectl describe pod <pod-name> to check the resource limits and requests set for the pod. For real-time data, kubectl top pod provides insight into current resource usage, which may reveal if resource limits need adjusting.
Identifying Health Probe Errors
A misconfigured readiness or liveness probe can place a pod in CrashLoopBackoff as Kubernetes uses the probes to check the health of a service and will restart pods that don't have successful health checks. Review the configuration of these probes to ensure they align with your application’s actual health endpoints. You can manually test these endpoints with tools like curl to confirm they return the expected responses. Setting probe failure thresholds and timeouts appropriately is crucial to avoid unnecessary restarts.

In the above deployment, we can see that the liveness and readiness probes are misconfigured to the wrong ports.
Analyzing Pod Logs for More Clues
If the previous steps didn't reveal the issue, it's time to dig into the pod's logs. Use kubectl logs <pod-name> --tail 20 to view the past 20 logs for your pod. Review these logs for patterns like stack traces, configuration errors, or messages about missing dependencies. If the error appears before your application has even started (and therefore isn't being logged), it may indicate a problem with the pod's entry point or configuration.

Don't Forget to Check the Deployment
Sometimes the root cause of a CrashLoopBackOff state lies not with the pod itself but with the deployment configuration. A deployment’s configuration determines how many replicas are managed, how they’re updated, and what configurations or limits are applied. Start by describing the deployment with:
kubectl describe deployment <deployment-name>Check for any issues in the deployment specification, such as:
Incorrect Resource Limits: If CPU or memory limits are too restrictive, pods may fail to start or restart frequently. Adjust resource requests and limits in the deployment spec to ensure the pod has enough resources.
Rolling Updates: Look for rollout-related events, especially if you recently updated the deployment. Misconfigurations in
maxUnavailableormaxSurgecan impact pod stability.Environment Variables and Secrets: If the pod depends on environment variables or secrets defined in the deployment, make sure they are correctly configured and accessible.
How Parity Uses AI to Debug CrashLoopBackoff and other k8s issues
At Parity, we've built an AI SRE for incident response. Nobody likes waking up at 2am and investigating an issue in production. Instead, Parity investigates that issue on your behalf and hands over the results to you so you can quickly resolve the issue and get back to bed. CrashLoopBackoff has many potential causes, and Parity can evaluate them all at once and quickly pinpoint the issue. If you're interested in giving it a try, book a demo with us! If you want to learn more about why we've built Parity, check out our launch post!
Conclusion
Debugging CrashLoopBackOff errors in Kubernetes might seem overwhelming, but tackling it step-by-step makes it much easier to manage. By checking pod descriptions, digging into logs, and looking over your health probes and deployments, you can usually spot the issue pretty quickly. Plus, using tools like Parity’s AI SRE can take a lot of the hassle out of troubleshooting, handling the heavy lifting so you can solve problems faster and keep things running smoothly. With these tips and tools in hand, you’ll be ready to take on CrashLoopBackOff errors and keep your Kubernetes apps up and running without breaking a sweat.
Share
HN
Revolutionize Your Incident Response
Revolutionize Your Incident Response
Transform your on-call with Parity's AI SRE. Parity works with your team to resolve incidents in seconds, not hours.
Transform your on-call with Parity's AI SRE. Parity works with your team to resolve incidents in seconds, not hours.

You may also like
You may also like


Wilson Spearman
Co-founder
Mar 20, 2025
You Spend Millions on Reliability. So why Does Everything Still Break?
Reliability's Expensive and Everything Still Breaks. Why?


Wilson Spearman
Co-founder
Mar 20, 2025
You Spend Millions on Reliability. So why Does Everything Still Break?
Reliability's Expensive and Everything Still Breaks. Why?


Wilson Spearman
Co-founder
Jan 31, 2025
Is the Helm Killer Finally Here?
AWS, Google Cloud, and Microsoft unveil kro, a k8s-native, cloud-agnostic package manager


Wilson Spearman
Co-founder
Jan 31, 2025
Is the Helm Killer Finally Here?
AWS, Google Cloud, and Microsoft unveil kro, a k8s-native, cloud-agnostic package manager
